share
GENERAL
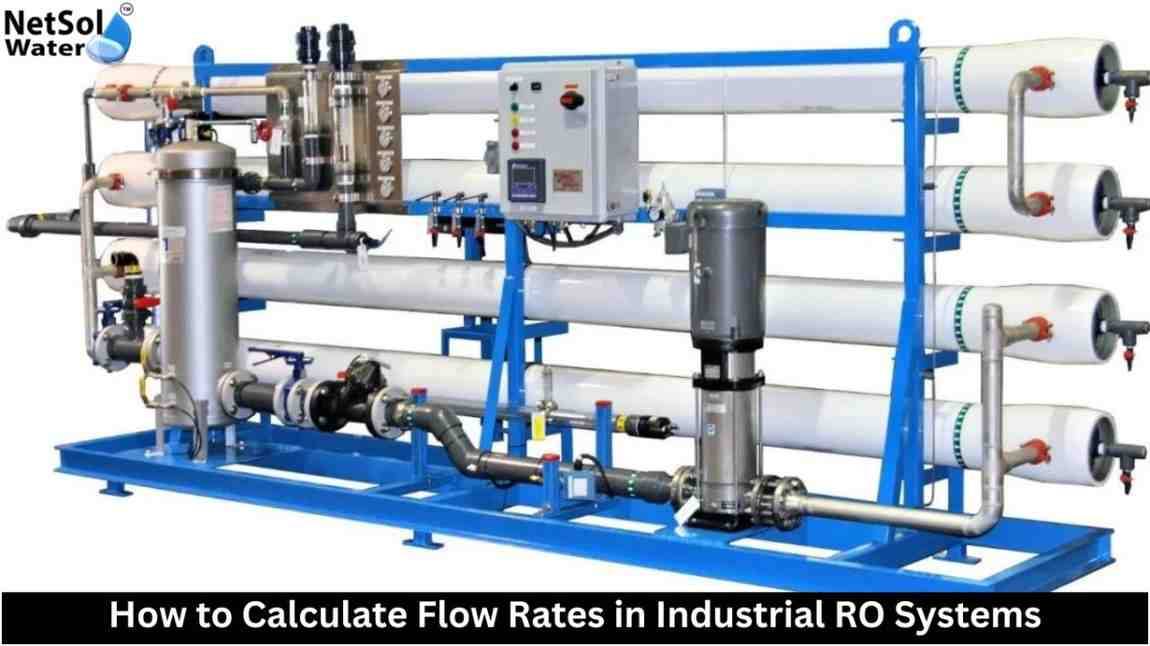
How to Calculate Flow Rate in RO Systems | Industrial RO Plant Guide
Sept. 7, 2025
267 Views
How to Calculate Flow Rates in Industrial RO Systems
✅ Introduction
Flow rate is one of the most critical performance indicators in industrial reverse osmosis (RO) systems. It determines how much purified water is produced and how efficiently the system operates. In this guide, you will learn how to calculate flow rates in RO plants, what factors affect flow, and how to optimize system performance for consistent output and longer membrane life.
Whether you're an engineer, operator, or an Industrial RO Plant Manufacturer, understanding flow rate calculation is key to maximizing system efficiency.
🔗 Related Pages:
RO Plants on Plumint | Professional Plumbers
🔍 What is Flow Rate in RO Systems?
Flow rate refers to the volume of water passing through the RO membrane per unit of time. It is usually expressed in liters per hour (LPH) or gallons per minute (GPM).
📌 Why Flow Rate Matters:
-
Ensures system meets design capacity
-
Affects membrane performance
-
Controls product water quality
-
Reduces operational costs and energy usage
📏 Units Used in Flow Rate Calculations
-
LPH (Liters per Hour) – commonly used in India and most of Asia
-
GPM (Gallons per Minute) – mostly used in the USA
-
m³/hr (Cubic Meters per Hour) – for large industrial plants
Always convert your units for consistency before performing calculations.
🧠 Key Factors Affecting RO Flow Rate
Several variables influence the actual flow rate of an RO plant:
1. Feed Water Pressure
Higher pressure increases water penetration through the membrane, improving flow rate.
2. Membrane Condition
Old or fouled membranes reduce water flow, requiring cleaning or replacement.
3. Temperature
Higher temperatures decrease water viscosity and increase flow. RO systems typically operate better at 25°C.
4. TDS (Total Dissolved Solids)
Higher TDS levels in feed water increase osmotic pressure, lowering flow efficiency.
📐 How to Measure Flow Rate in RO Plants
Here are some common tools and techniques used to measure flow:
✅ Mechanical Flow Meters
Rotating paddles or turbines measure water volume based on revolutions.
✅ Ultrasonic Flow Sensors
Use sound waves to detect flow without contacting water.
✅ Magnetic Flow Meters
Ideal for conductive liquids, they calculate flow using electromagnetic signals.
Choose the right flow meter based on plant size, accuracy requirements, and budget.
Let’s go step-by-step:
Step 1: Record Raw Flow Meter Data
Measure total flow in LPH or GPM using the installed device.
Step 2: Apply Correction for Pressure & Temperature
Use the membrane manufacturer’s correction charts to adjust for environmental variations.
Step 3: Use the Formula:
Adjusted Flow Rate = Raw Flow Rate × Correction Factor
This gives you the actual flow rate under standard conditions.
🧪 Example: Flow Rate Calculation
🔧 Optimizing RO Flow Rate for Performance
🔄 Regular Monitoring
Check daily flow readings to detect performance drops early.
🧼 Membrane Cleaning
Remove scaling or fouling to restore optimal flow.
⚙️ Pressure Adjustments
Fine-tune pressure settings to maintain the target range.
📊 Data Logging
Use SCADA or IoT tools to track long-term trends and predict maintenance.
✅ Conclusion
Accurate flow rate calculation is essential for maximizing the efficiency, longevity, and output quality of your industrial RO system. With the right tools and techniques, you can ensure that your system stays within optimal operating conditions.
💡 Looking for expert help or a new RO system?
📞 Contact Netsol Water Today:
🔗 Check also:
Explore RO Plants on Plumint | Hire Certified Plumbers
share Share now