share
BUSINESS
How to Visualize Your Sales Funnel with Real-Time Reporting
Sept. 7, 2025
24 Views
🚀 Introduction: Why Sales Funnel Visualization Is Game-Changing
In a competitive market, understanding your customer journey is no longer optional — it’s mission-critical.
From lead generation to closing a deal, every business has a sales funnel. But most businesses struggle to track and visualize it in real time. As a result:
-
Leads fall through the cracks
-
Conversion bottlenecks go unnoticed
-
Decision-making is based on guesses, not data
The solution? Use real-time reporting tools like Plumint.com to visualize your sales funnel clearly and take immediate action.
🔍 What Is a Sales Funnel?
A sales funnel represents the step-by-step journey a prospect takes from awareness to purchase.
Common Funnel Stages:
-
Top of Funnel (TOFU) – Awareness: Ads, blogs, SEO
-
Middle of Funnel (MOFU) – Consideration: Landing pages, lead forms, follow-ups
-
Bottom of Funnel (BOFU) – Decision: Demos, pricing, negotiations, closing
Each stage of the funnel has its own purpose, tools, and conversion metrics.
💡 Why Visualization Matters
Sales funnel visualization means turning data into clear, digestible visuals (graphs, charts, dashboards) that answer key questions like:
-
Where are leads dropping off?
-
Which stage has the highest conversion rate?
-
What’s the average time to close a deal?
-
Which sources bring high-quality leads?
Visualizing this in real time allows businesses to optimize faster, convert better, and sell smarter.
🔧 Plumint.com — The Ultimate Funnel Visualization Tool
At the heart of this process is Plumint.com, a platform built for small businesses, agencies, and solopreneurs.
With Plumint, you can:
-
Build a custom funnel dashboard
-
Track leads across each stage
-
Visualize real-time drop-offs & conversion rates
-
Integrate campaign & CRM data
-
Set automation rules for different funnel stages
No coding. No spreadsheets. Just real-time clarity.
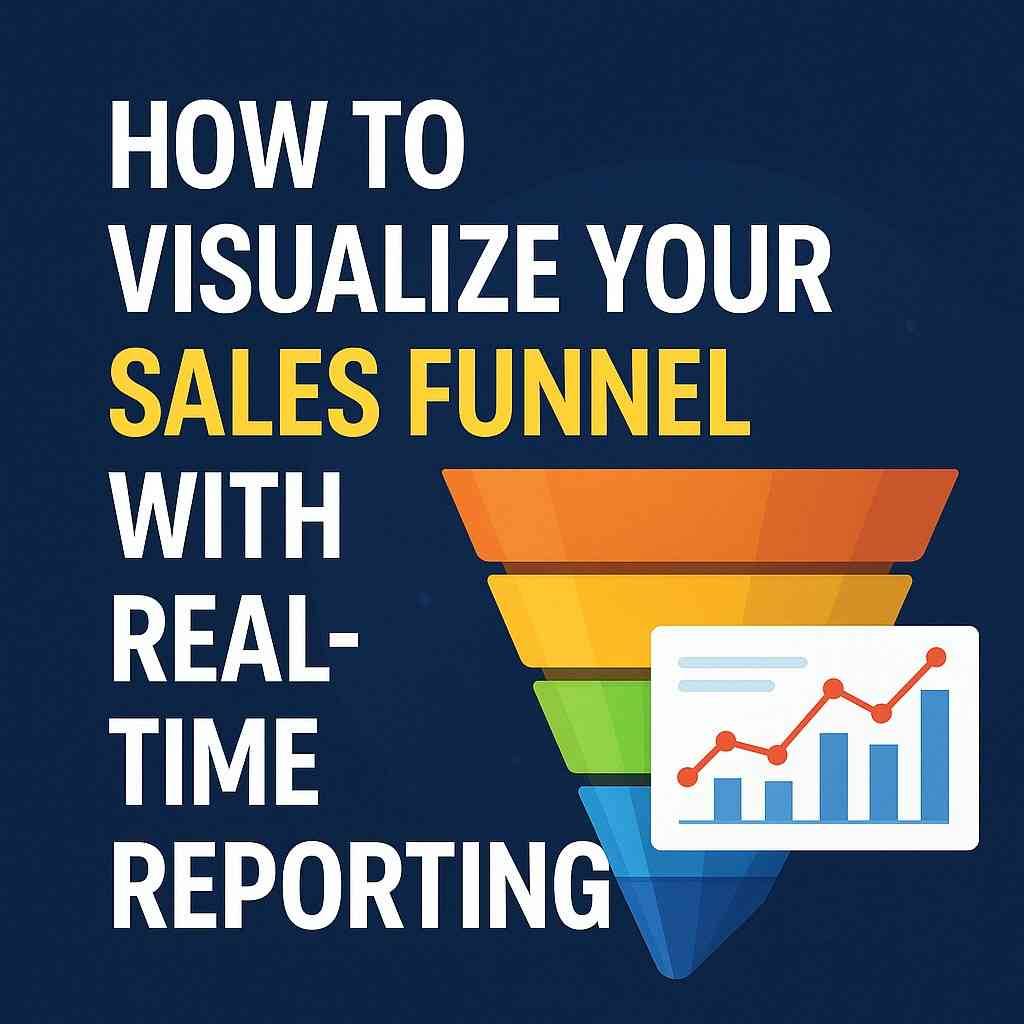
📊 What Does a Visual Sales Funnel Look Like?
Imagine a simple funnel chart with:
-
Visitors: 10,000
-
Leads Captured: 1,500
-
Qualified Leads: 800
-
Demos Booked: 300
-
Customers: 75
With Plumint, you can view this as:
📈 Key Metrics to Track in a Funnel Report
| Funnel Stage |
Metric |
Why It Matters |
| Awareness |
Impressions, Clicks |
Measure traffic sources |
| Lead Generation |
Form fills, Signups |
Assess campaign effectiveness |
| Qualification |
Lead Score, Response Time |
Identify high-intent prospects |
| Engagement |
Open rate, Demo bookings |
Understand interest levels |
| Conversion |
Sales, Closing ratio |
Track overall funnel performance |
Plumint tracks all these metrics automatically when leads enter your CRM.
🛠️ How to Set Up Real-Time Funnel Reporting in Plumint
Here’s a beginner-friendly guide:
✅ Step 1: Create Your Funnel in CRM
Define your funnel stages:
-
Lead Captured
-
Qualified
-
Proposal Sent
-
Deal Closed
You can customize stages in Plumint to fit your business.
✅ Step 2: Integrate Lead Sources
Connect:
Plumint tags each lead by source and status automatically.
✅ Step 3: Use the Funnel Dashboard
Access Plumint’s real-time visual dashboard to:
✅ Step 4: Automate Based on Funnel Data
Examples:
-
Lead unresponsive after 5 days? → Auto send reminder
-
Demo booked but no show? → Trigger follow-up email
-
High-value lead? → Tag VIP and notify sales team
✅ Step 5: Download Reports or Share via WhatsApp
-
Send PDF reports to team/investors
-
Schedule auto-delivery every week or month
-
Customize views based on user role (e.g., manager vs agent)
🚀 Real Case Study: Agency Doubles Conversion Rate
Business: B2B Marketing Agency
Problem: Low demo-to-client conversion
Tool: Plumint's Funnel + Automation
What They Did:
-
Visualized sales funnel for 3 services
-
Identified 42% drop at "Follow-up Needed" stage
-
Set automated WhatsApp reminders after 24 hours
-
Added urgency CTA in follow-up emails
Results:
-
Demo-to-client conversion jumped from 15% to 31%
-
Saved 12 hours/week in manual follow-ups
-
Increased deal closures by 2x in 45 days
🔄 Funnel Optimization Tips
-
Define Your Funnel Clearly
Set distinct stages and avoid overlaps
-
Use Consistent Lead Scoring
Automate qualification based on behavior
-
Track Funnel Velocity
How fast leads move from stage to stage
-
Automate Follow-Ups
Don’t rely on memory — use triggers
-
A/B Test Touchpoints
Emails, WhatsApp messages, CTA buttons
📌 Sales Funnel vs Marketing Funnel: What’s the Difference?
| Feature |
Marketing Funnel |
Sales Funnel |
| Focus |
Awareness & interest |
Decision & conversion |
| Metrics |
Clicks, views, signups |
Demos, calls, purchases |
| Tools |
Ads, blogs, lead magnets |
CRM, proposals, invoices |
| Visualization Use |
Traffic sources |
Deal stages & drop-offs |
Plumint lets you build both, under one dashboard.
🔐 FAQs
Q1: I don’t have a dedicated sales team. Can I still use funnel reports?
A: Yes! Even solopreneurs or freelancers benefit from funnel tracking — from inquiry to payment.
Q2: Can I view different funnels for different products?
A: Absolutely. Plumint allows you to build multiple funnels and compare them side-by-side.
Q3: Can funnel reports be shared automatically with my team?
A: Yes, with scheduled PDF reports via email or WhatsApp.
🔚 Conclusion: See It. Fix It. Scale It.
In 2025, businesses that visualize their sales funnel in real time will out-convert and outgrow those that don’t.
With Plumint.com, you get:
✅ Real-time reporting
✅ Clear funnel visualization
✅ Smart automations
✅ Faster conversions
No more flying blind. Start tracking, tweaking, and thriving.
👉 Try Plumint now at Plumint.com
Also Read,
How to Automate Your Customer Follow-Up Emails with Plumint
10 Powerful Business Automation Tools Every Small Business Should Use
Why Automation is the Future of Small Business Operations
Workflow Automation for Beginners: Save 10+ Hours a Week
How to Use Data Analytics to Grow Your Business in 2025
Top 7 Business Metrics Every Founder Should Track
Monthly Report Automation: Tools That Save Time & Improve Accuracy
share Share now


